
6 analysts have shared their evaluations of Par Pacific Hldgs PARR during the recent three months, expressing a mix of bullish and bearish perspectives.
The table below provides a snapshot of their recent ratings, showcasing how sentiments have evolved over the past 30 days and comparing them to the preceding months.
| Bullish | Somewhat Bullish | Indifferent | Somewhat Bearish | Bearish | |
|---|---|---|---|---|---|
| Total Ratings | 1 | 3 | 2 | 0 | 0 |
| Last 30D | 1 | 0 | 0 | 0 | 0 |
| 1M Ago | 0 | 1 | 1 | 0 | 0 |
| 2M Ago | 0 | 0 | 1 | 0 | 0 |
| 3M Ago | 0 | 2 | 0 | 0 | 0 |
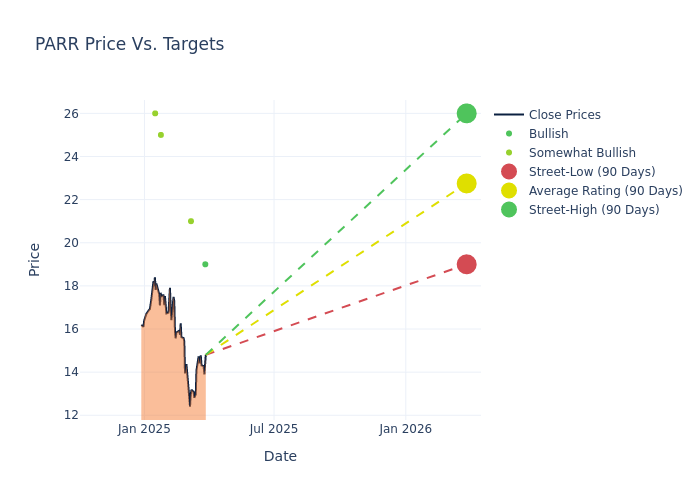
Insights from analysts' 12-month price targets are revealed, presenting an average target of $21.5, a high estimate of $26.00, and a low estimate of $18.00. Observing a downward trend, the current average is 4.87% lower than the prior average price target of $22.60.
Analyzing Analyst Ratings: A Detailed Breakdown
An in-depth analysis of recent analyst actions unveils how financial experts perceive Par Pacific Hldgs. The following summary outlines key analysts, their recent evaluations, and adjustments to ratings and price targets.
| Analyst | Analyst Firm | Action Taken | Rating | Current Price Target | Prior Price Target |
|---|---|---|---|---|---|
| Neil Mehta | Goldman Sachs | Raises | Buy | $19.00 | $18.00 |
| Nitin Kumar | Piper Sandler | Lowers | Overweight | $21.00 | $25.00 |
| Neil Mehta | Goldman Sachs | Lowers | Neutral | $18.00 | $20.00 |
| Neil Mehta | Goldman Sachs | Lowers | Neutral | $20.00 | $23.00 |
| Justin Jenkins | Raymond James | Announces | Outperform | $25.00 | - |
| John Royall | JP Morgan | Lowers | Overweight | $26.00 | $27.00 |
Key Insights:
- Action Taken: Analysts frequently update their recommendations based on evolving market conditions and company performance. Whether they 'Maintain', 'Raise' or 'Lower' their stance, it reflects their reaction to recent developments related to Par Pacific Hldgs. This information provides a snapshot of how analysts perceive the current state of the company.
- Rating: Gaining insights, analysts provide qualitative assessments, ranging from 'Outperform' to 'Underperform'. These ratings reflect expectations for the relative performance of Par Pacific Hldgs compared to the broader market.
- Price Targets: Analysts set price targets as an estimate of a stock's future value. Comparing the current and prior price targets provides insight into how analysts' expectations have changed over time. This information can be valuable for investors seeking to understand consensus views on the stock's potential future performance.
To gain a panoramic view of Par Pacific Hldgs's market performance, explore these analyst evaluations alongside essential financial indicators. Stay informed and make judicious decisions using our Ratings Table.
Stay up to date on Par Pacific Hldgs analyst ratings.
If you are interested in following small-cap stock news and performance you can start by tracking it here.
Get to Know Par Pacific Hldgs Better
Par Pacific Holdings Inc is an oil and gas company that manages and maintains interests in energy and infrastructure businesses. The company has three reportable segments namely Refining, Under its refining business, the company produces ultra-low-sulfur diesel, gasoline, jet fuel, marine fuel, LSFO, and other associated refined products. Its Retail includes operation licenses out brands to serve the retail consumer. Through the Logistics segment, crude shipments are delivered to the refineries, in addition to finished products that are exported. It generates maximum revenue from the Refining segment.
Par Pacific Hldgs: A Financial Overview
Market Capitalization Analysis: The company's market capitalization is below the industry average, suggesting that it is relatively smaller compared to peers. This could be due to various factors, including perceived growth potential or operational scale.
Decline in Revenue: Over the 3 months period, Par Pacific Hldgs faced challenges, resulting in a decline of approximately -16.09% in revenue growth as of 31 December, 2024. This signifies a reduction in the company's top-line earnings. As compared to its peers, the revenue growth lags behind its industry peers. The company achieved a growth rate lower than the average among peers in Energy sector.
Net Margin: Par Pacific Hldgs's net margin surpasses industry standards, highlighting the company's exceptional financial performance. With an impressive -3.04% net margin, the company effectively manages costs and achieves strong profitability.
Return on Equity (ROE): The company's ROE is a standout performer, exceeding industry averages. With an impressive ROE of -4.56%, the company showcases effective utilization of equity capital.
Return on Assets (ROA): Par Pacific Hldgs's ROA stands out, surpassing industry averages. With an impressive ROA of -1.45%, the company demonstrates effective utilization of assets and strong financial performance.
Debt Management: Par Pacific Hldgs's debt-to-equity ratio is below the industry average at 1.32, reflecting a lower dependency on debt financing and a more conservative financial approach.
Analyst Ratings: What Are They?
Experts in banking and financial systems, analysts specialize in reporting for specific stocks or defined sectors. Their comprehensive research involves attending company conference calls and meetings, analyzing financial statements, and engaging with insiders to generate what are known as analyst ratings for stocks. Typically, analysts assess and rate each stock once per quarter.
Analysts may supplement their ratings with predictions for metrics like growth estimates, earnings, and revenue, offering investors a more comprehensive outlook. However, investors should be mindful that analysts, like any human, can have subjective perspectives influencing their forecasts.
Breaking: Wall Street's Next Big Mover
Benzinga's #1 analyst just identified a stock poised for explosive growth. This under-the-radar company could surge 200%+ as major market shifts unfold. Click here for urgent details.
This article was generated by Benzinga's automated content engine and reviewed by an editor.
Edge Rankings
Price Trend
© 2025 Benzinga.com. Benzinga does not provide investment advice. All rights reserved.
date | ticker | name | Price Target | Upside/Downside | Recommendation | Firm |
|---|
Trade confidently with insights and alerts from analyst ratings, free reports and breaking news that affects the stocks you care about.

