Why MICROSOFT CORP (NASDAQ:MSFT) is a Top Pick for Dividend Investors.
By Mill Chart
Last update: Mar 26, 2025
Discover MICROSOFT CORP (NASDAQ:MSFT)—a stock that our stock screener has recognized as a solid dividend pick with strong fundamentals. MSFT showcases decent financial health and profitability while providing a sustainable dividend. We'll explore the specifics further.
Assessing Dividend Metrics for MSFT
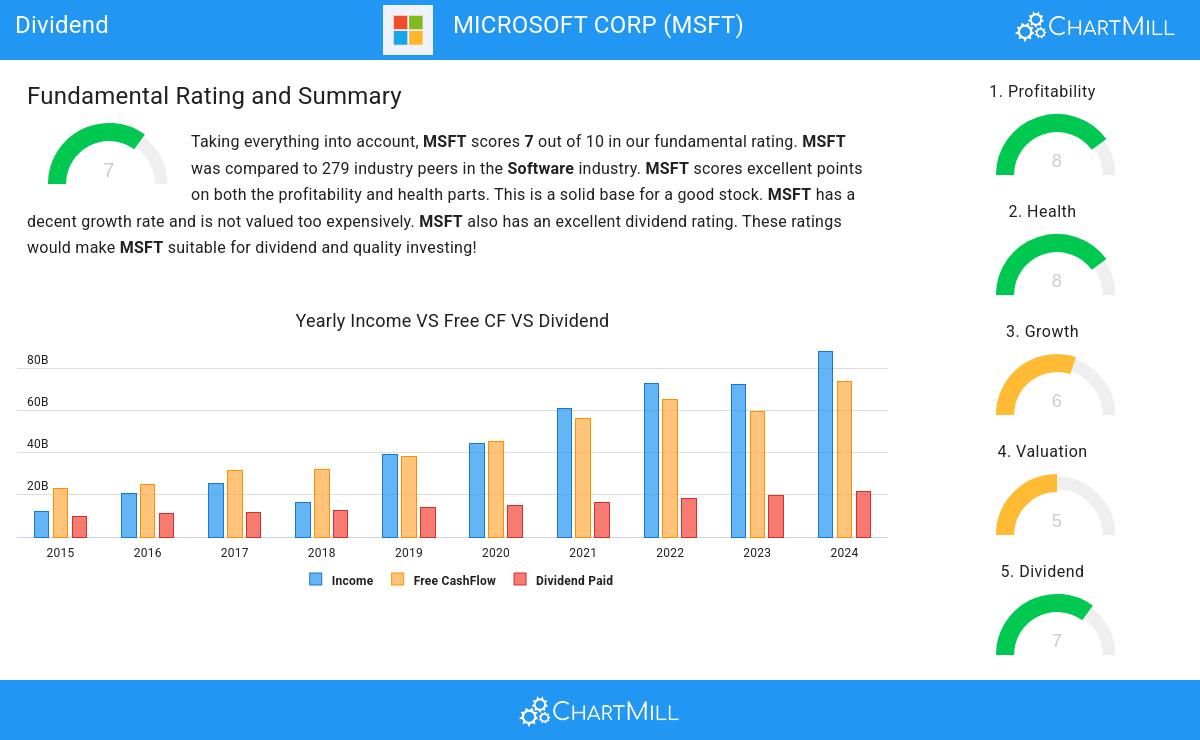
ChartMill employs its own Dividend Rating system for all stocks. This score, on a scale of 0 to 10, is determined by evaluating different dividend factors, such as yield, historical performance, dividend growth, and sustainability. MSFT has been assigned a 7 for dividend:
- Compared to an average industry Dividend Yield of 12.67, MSFT pays a better dividend. On top of this MSFT pays more dividend than 91.76% of the companies listed in the same industry.
- The dividend of MSFT is nicely growing with an annual growth rate of 10.19%!
- MSFT has paid a dividend for at least 10 years, which is a reliable track record.
- MSFT has not decreased its dividend for at least 10 years, so it has a reliable track record of non decreasing dividend.
- MSFT pays out 24.68% of its income as dividend. This is a sustainable payout ratio.
- MSFT's earnings are growing more than its dividend. This makes the dividend growth sustainable.
Evaluating Health: MSFT
Every stock is evaluated by ChartMill, receiving a Health Rating on a scale of 0 to 10. This assessment considers different health aspects, including liquidity and solvency, both in absolute terms and relative to industry peers. MSFT has achieved a 8 out of 10:
- MSFT has an Altman-Z score of 9.46. This indicates that MSFT is financially healthy and has little risk of bankruptcy at the moment.
- The Altman-Z score of MSFT (9.46) is better than 83.87% of its industry peers.
- MSFT has a debt to FCF ratio of 1.16. This is a very positive value and a sign of high solvency as it would only need 1.16 years to pay back of all of its debts.
- MSFT's Debt to FCF ratio of 1.16 is fine compared to the rest of the industry. MSFT outperforms 70.61% of its industry peers.
- MSFT has a Debt/Equity ratio of 0.24. This is a healthy value indicating a solid balance between debt and equity.
- MSFT does not score too well on the current and quick ratio evaluation. However, as it has excellent solvency and profitability, these ratios do not necessarly indicate liquidity issues and need to be evaluated against the specifics of the business.
Profitability Assessment of MSFT
ChartMill assigns a proprietary Profitability Rating to each stock. The score is computed by evaluating various profitability ratios and margins and ranges from 0 to 10. MSFT was assigned a score of 8 for profitability:
- MSFT has a better Return On Assets (17.37%) than 93.19% of its industry peers.
- MSFT has a better Return On Equity (30.64%) than 91.40% of its industry peers.
- With an excellent Return On Invested Capital value of 22.54%, MSFT belongs to the best of the industry, outperforming 96.06% of the companies in the same industry.
- Measured over the past 3 years, the Average Return On Invested Capital for MSFT is significantly above the industry average of 10.64%.
- Looking at the Profit Margin, with a value of 35.43%, MSFT belongs to the top of the industry, outperforming 94.62% of the companies in the same industry.
- In the last couple of years the Profit Margin of MSFT has grown nicely.
- MSFT's Operating Margin of 44.96% is amongst the best of the industry. MSFT outperforms 98.92% of its industry peers.
- In the last couple of years the Operating Margin of MSFT has grown nicely.
More Best Dividend stocks can be found in our Best Dividend screener.
For an up to date full fundamental analysis you can check the fundamental report of MSFT
Disclaimer
This article should in no way be interpreted as advice. The article is based on the observed metrics at the time of writing, but you should always make your own analysis and trade or invest at your own responsibility.
NASDAQ:MSFT (3/31/2025, 9:49:10 AM)
368.82
-9.98 (-2.63%)
Find more stocks in the Stock Screener
MSFT Latest News and Analysis
 5 days ago - ChartmillWhy MICROSOFT CORP (NASDAQ:MSFT) is a Top Pick for Dividend Investors.
Why MICROSOFT CORP (NASDAQ:MSFT) qualifies as a good dividend investing stock.
 18 days ago - ChartmillMarket Monitor March 12 ( Tesla, Nvidia UP, Apple, United Airlines DOWN)
Stock Market Rebounds as Inflation Eases, But Trade Worries Persist
 20 days ago - ChartmillMarket Monitor March 10 ( Kratos Defense & Security UP, Tesla, Microstrategy, Robinhood & Coinbase DOWN)
Wall Street Faces Heavy Losses Amid Recession Fears and Tech Sell-Off
