
Eastman Chemical Company (NYSE:EMN) saw lower profits in the first quarter of 2019, hurt by lower demand for its specialty products in China and Europe due to trade tensions. The chemical maker recorded profit of $209 million or $1.49 per share for the quarter, down roughly 28% from the year-ago profit of $290 million or $2.00.
Barring one-time items, earnings were $1.77 per share for the quarter, down from $2.23 in the year ago-quarter. Earnings also trailed the Zacks Consensus Estimate of $1.91.
Revenues dropped around 9% year over year to $2,380 million in the quarter. The company saw lower sales across its segments. The top line missed the Zacks Consensus Estimate of $2,602.6 million.
Eastman Chemical Company Price, Consensus and EPS Surprise
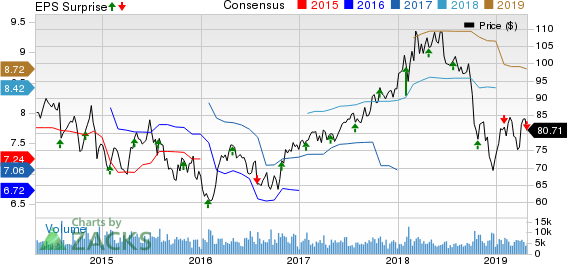
Eastman Chemical Company price-consensus-eps-surprise-chart | Eastman Chemical Company Quote
Segment Review
Revenues from the Additives and Functional Products division fell 9% year over year at $855 million for the reported quarter. The decline was due to lower sales for adhesives resins and tire additives products, unfavorable foreign currency impact and reduced selling prices.
Revenues from the Advanced Materials unit declined 5% year over year to $657 million. The decline is attributable to reduced sales volume for specialty plastics due to customer inventory destocking associated with the U.S.-China trade conflict as well as unfavorable foreign currency impact.
Chemical Intermediates sales went down 10% to $655 million, hurt by lower bulk ethylene sales volumes and reduced selling prices.
Fibers segment sales dropped 13% to $213 million, impacted by reduced acetate tow sales volumes and prices.
Financials
Eastman Chemical ended the quarter with cash and cash equivalents of $195 million, flat year over year. Net debt at the end of the quarter was $6,269 million, down around 7% year over year.
The company returned $212 million to shareholders through share repurchases and dividends during the quarter.
Outlook
Moving ahead, Eastman Chemical expects strong earnings growth in the second quarter on a sequential comparison basis. However, the company expects the difficult global business environment to continue through first-half 2019. The company is taking additional cost reduction actions in the wake of the challenging business environment. It expects global economy to strengthen in the second half of 2019. The company continues to expects adjusted earnings per share growth of 6-10% in 2019.
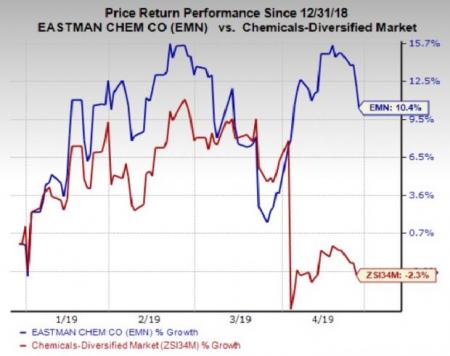
Price Performance
Eastman Chemical’s shares have gained 10.4% year to date, outperforming the 2.3% decline of the industry it belongs to.
Zacks Rank and Stocks to Consider
Eastman Chemical currently carries a Zacks Rank #3 (Hold).
Better-ranked stocks in the basic materials space include Sandstorm Gold Ltd. (NYSE:SAND) , Flexible Solutions International Inc. (NYSE:FSI) and W. R. Grace & Co. (NYSE:GRA) .
Sandstorm Gold has an expected earnings growth rate of 200% for the current year and carries a Zacks Rank #1 (Strong Buy). The company’s shares have gained around 11% over the past year. You can see the complete list of today’s Zacks #1 Rank stocks here.
Flexible Solutions has an expected earnings growth rate of 171.4% for the current year and carries a Zacks Rank #2 (Buy). Its shares have rallied roughly 92% in the past year.
W. R. Grace has an expected earnings growth rate of 10.4% for the current year and carries a Zacks Rank #2. Its shares have gained around 6% in the past year.
Zacks' Top 10 Stocks for 2019
In addition to the stocks discussed above, would you like to know about our 10 finest buy-and-holds for the year?
Who wouldn't? Our annual Top 10s have beaten the market with amazing regularity. In 2018, while the market dropped -5.2%, the portfolio scored well into double-digits overall with individual stocks rising as high as +61.5%. And from 2012-2017, while the market boomed +126.3, Zacks' Top 10s reached an even more sensational +181.9%.
See Latest Stocks Today >>
Eastman Chemical Company (EMN): Free Stock Analysis Report
W.R. Grace & Co. (GRA): Free Stock Analysis Report
Flexible Solutions International Inc. (FSI): Free Stock Analysis Report
Sandstorm Gold Ltd (SAND): Free Stock Analysis Report
Original post
Zacks Investment Research